4 Results
4.1 Descriptives
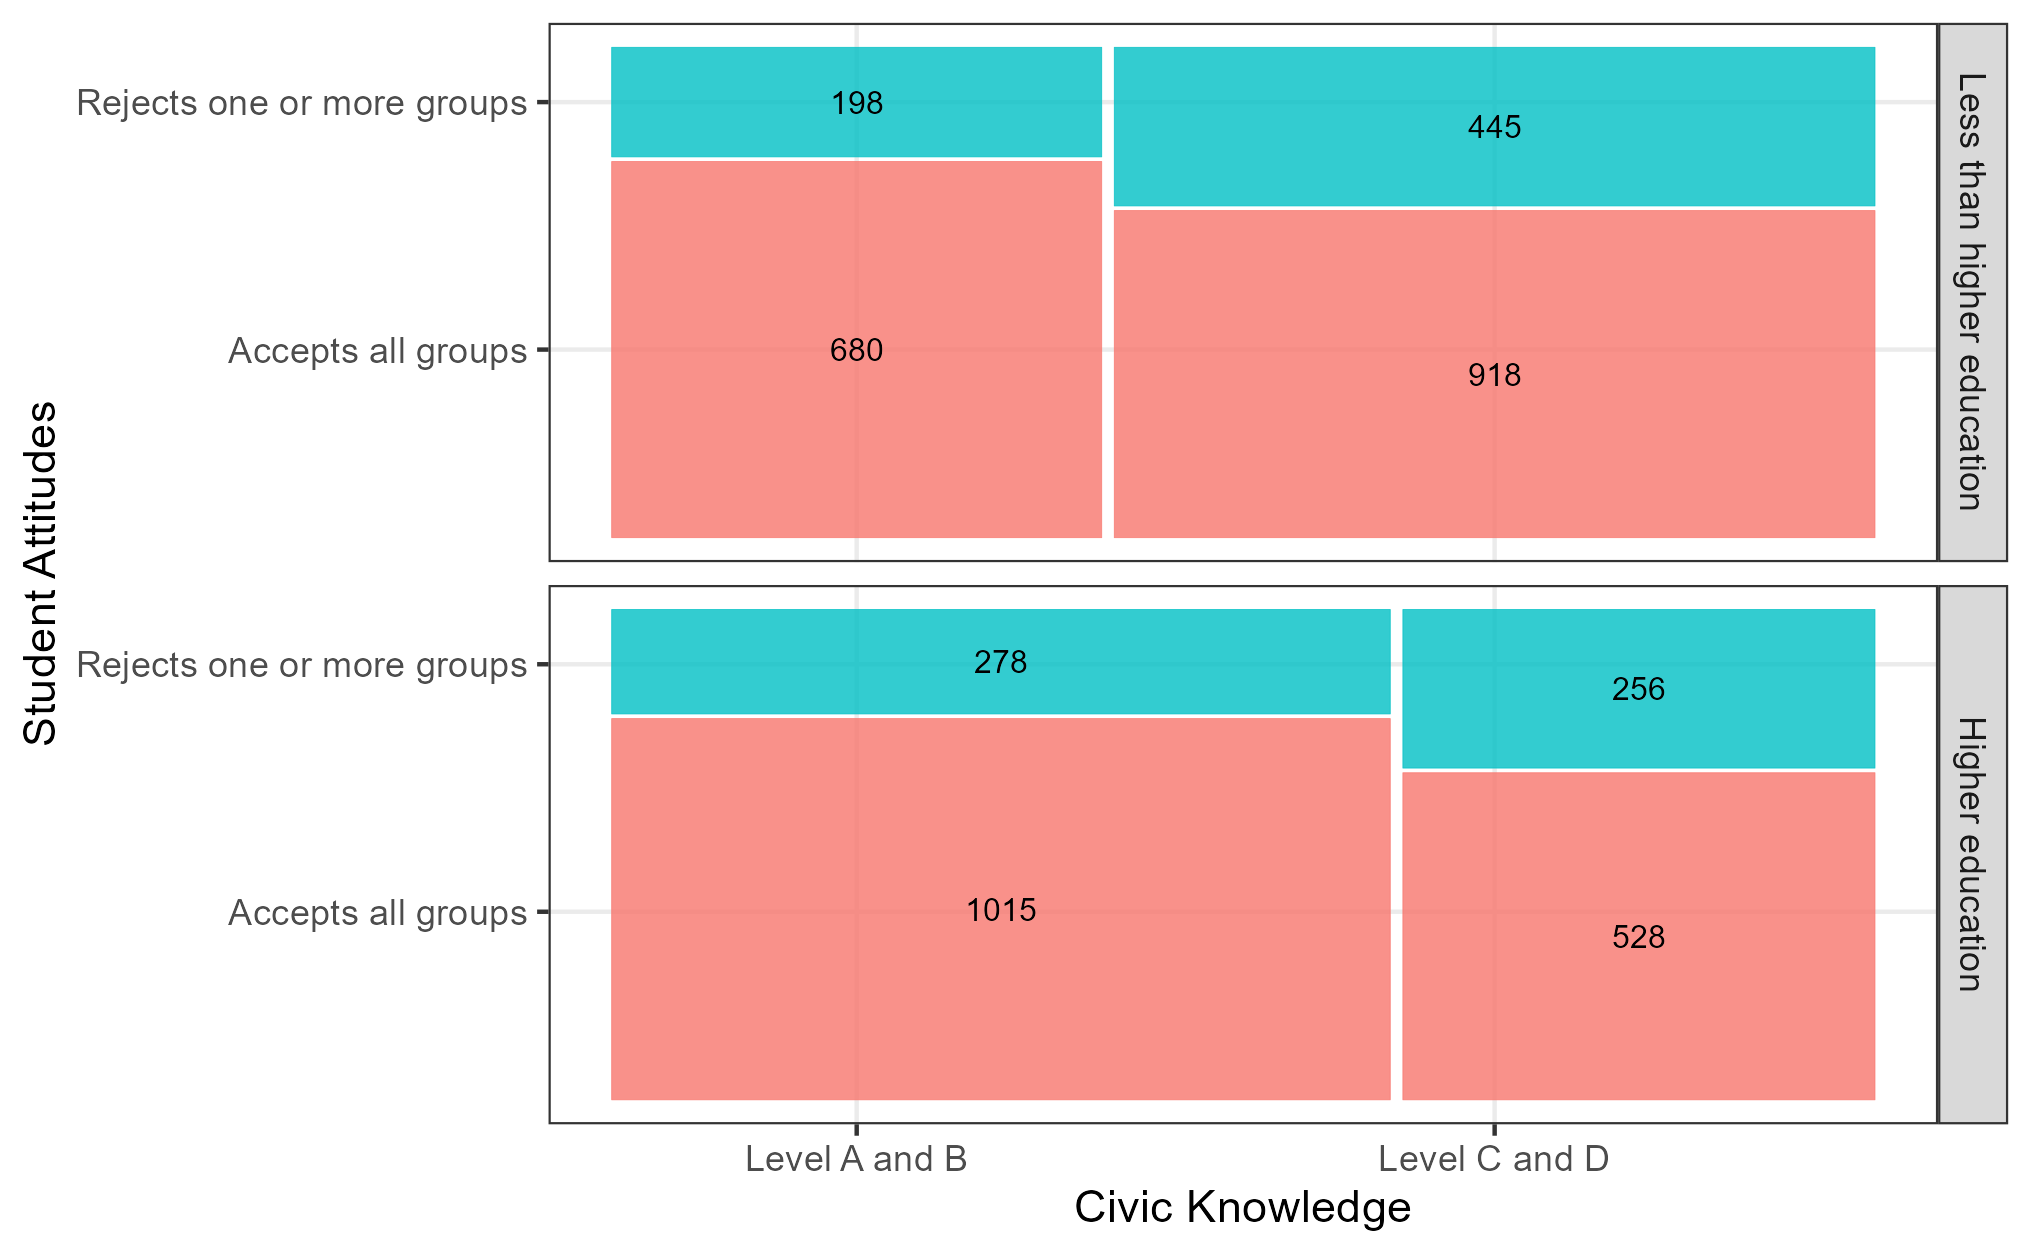
Figure 4.1: Relationship between Students’ Attitudes and Civic Knowledge by Parental Education Level
Figure 4.1 shows the distribution of students’ attitudes according to their level of civic knowledge and their parents’ educational attainment. The distribution indicates that while higher levels of civic knowledge (Levels A and B) are associated with a greater proportion of students who accept all social groups, it is important to highlight that most students with high civic knowledge have parents with higher education. The most notable contrast is that while 445 students (20%) whose parents have less than higher education reject one or more groups, only 256 students (12%) whose parents have higher education do so. Conversely, 680 students (30%) with parents who have less than higher education accept all groups, compared to 1,015 students (49%) whose parents have higher education and who accept all groups.
4.2 Multilevel analysis
Five multilevel regression models were estimated to predict the student diversity acceptance index. Each model included schools (MRBD) as a random effect. The logic behind model inclusion follows the sequence of the hypotheses: Model 1 includes family socioeconomic variables (H1); Model 2 adds parental attitudes (H2); Model 3 incorporates variables related to the school socialization process (H3 and H4); Model 4 adds contextual-level variables related to the municipalities where students live (H6, H7, and H8); and Model 5 includes the interaction between parental attitudes and the school-level average perception of openness to classroom discussion (H5).
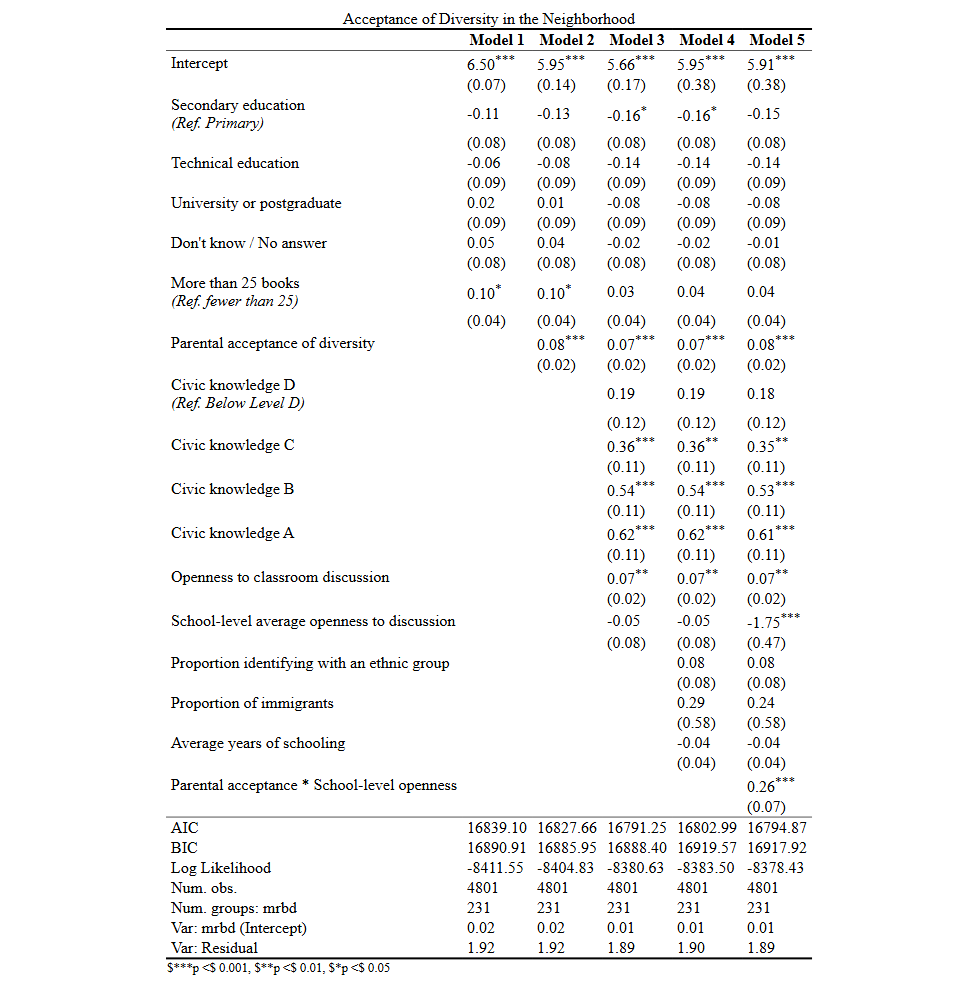
The intraclass correlation coefficient (ICC) of the null model (without predictors) is 0.012, and the explanatory power of Model 4—which includes all independent variables—is weak (R² = 0.03). The results of this estimation are presented in Table 4.1.
|
Parental education level variables are not statistically significant, except for the category of secondary education in Models 3 and 4 (\(\beta\) = -0.16, p < .05). Regarding the number of books at home, having more than 25 books shows a significant effect only in Models 1 and 2 (\(\beta\) = .10, p < .05), but this effect becomes statistically non-significant in the remaining models once other variables are controlled for.
Parental attitudes, measured through the diversity acceptance index, are statistically significant when controlling for other variables, and this relationship remains consistent across the four models in which the variable is included (Model 2 and Model 5: \(\beta\) = .08, p < .001; Model 3 and Model 4: \(\beta\) = .07, p < .001).
The variables related to the school socialization process are statistically significant at the individual level. Having a civic knowledge level of C (\(\beta\) = .36, p < .001), B (\(\beta\) = .54, p < .001), or A (\(\beta\) = .62, p < .001) is associated with higher levels of diversity acceptance among students compared to those with a civic knowledge level below Level D, holding all other variables constant. The index measuring perceived openness to classroom discussion is also positively associated with students’ acceptance of diversity (\(\beta\) = .07, p < .01), controlling for other variables. At the school level, the average perception of openness to classroom discussion is statistically significant only in Model 5, where it is included as part of the interaction term with parental attitudes (\(\beta\) = -1.76, p < .001).
The territorial variables capturing contextual characteristics of the municipality—namely, the proportion of people who identify with an ethnic group, the proportion of immigrants, and the average level of educational attainment—do not show a statistically significant association with students’ attitudes.
Finally, cross-level interaction effects were estimated. These effects make it possible to evaluate whether contextual characteristics—specifically, the school-level average perception of openness to classroom discussion—moderate the effect of parental attitudes2. Model 5 shows a positive interaction (\(\beta\) = .26, p < .001) between the school-level average perception of openness to discussion and parental attitudes.
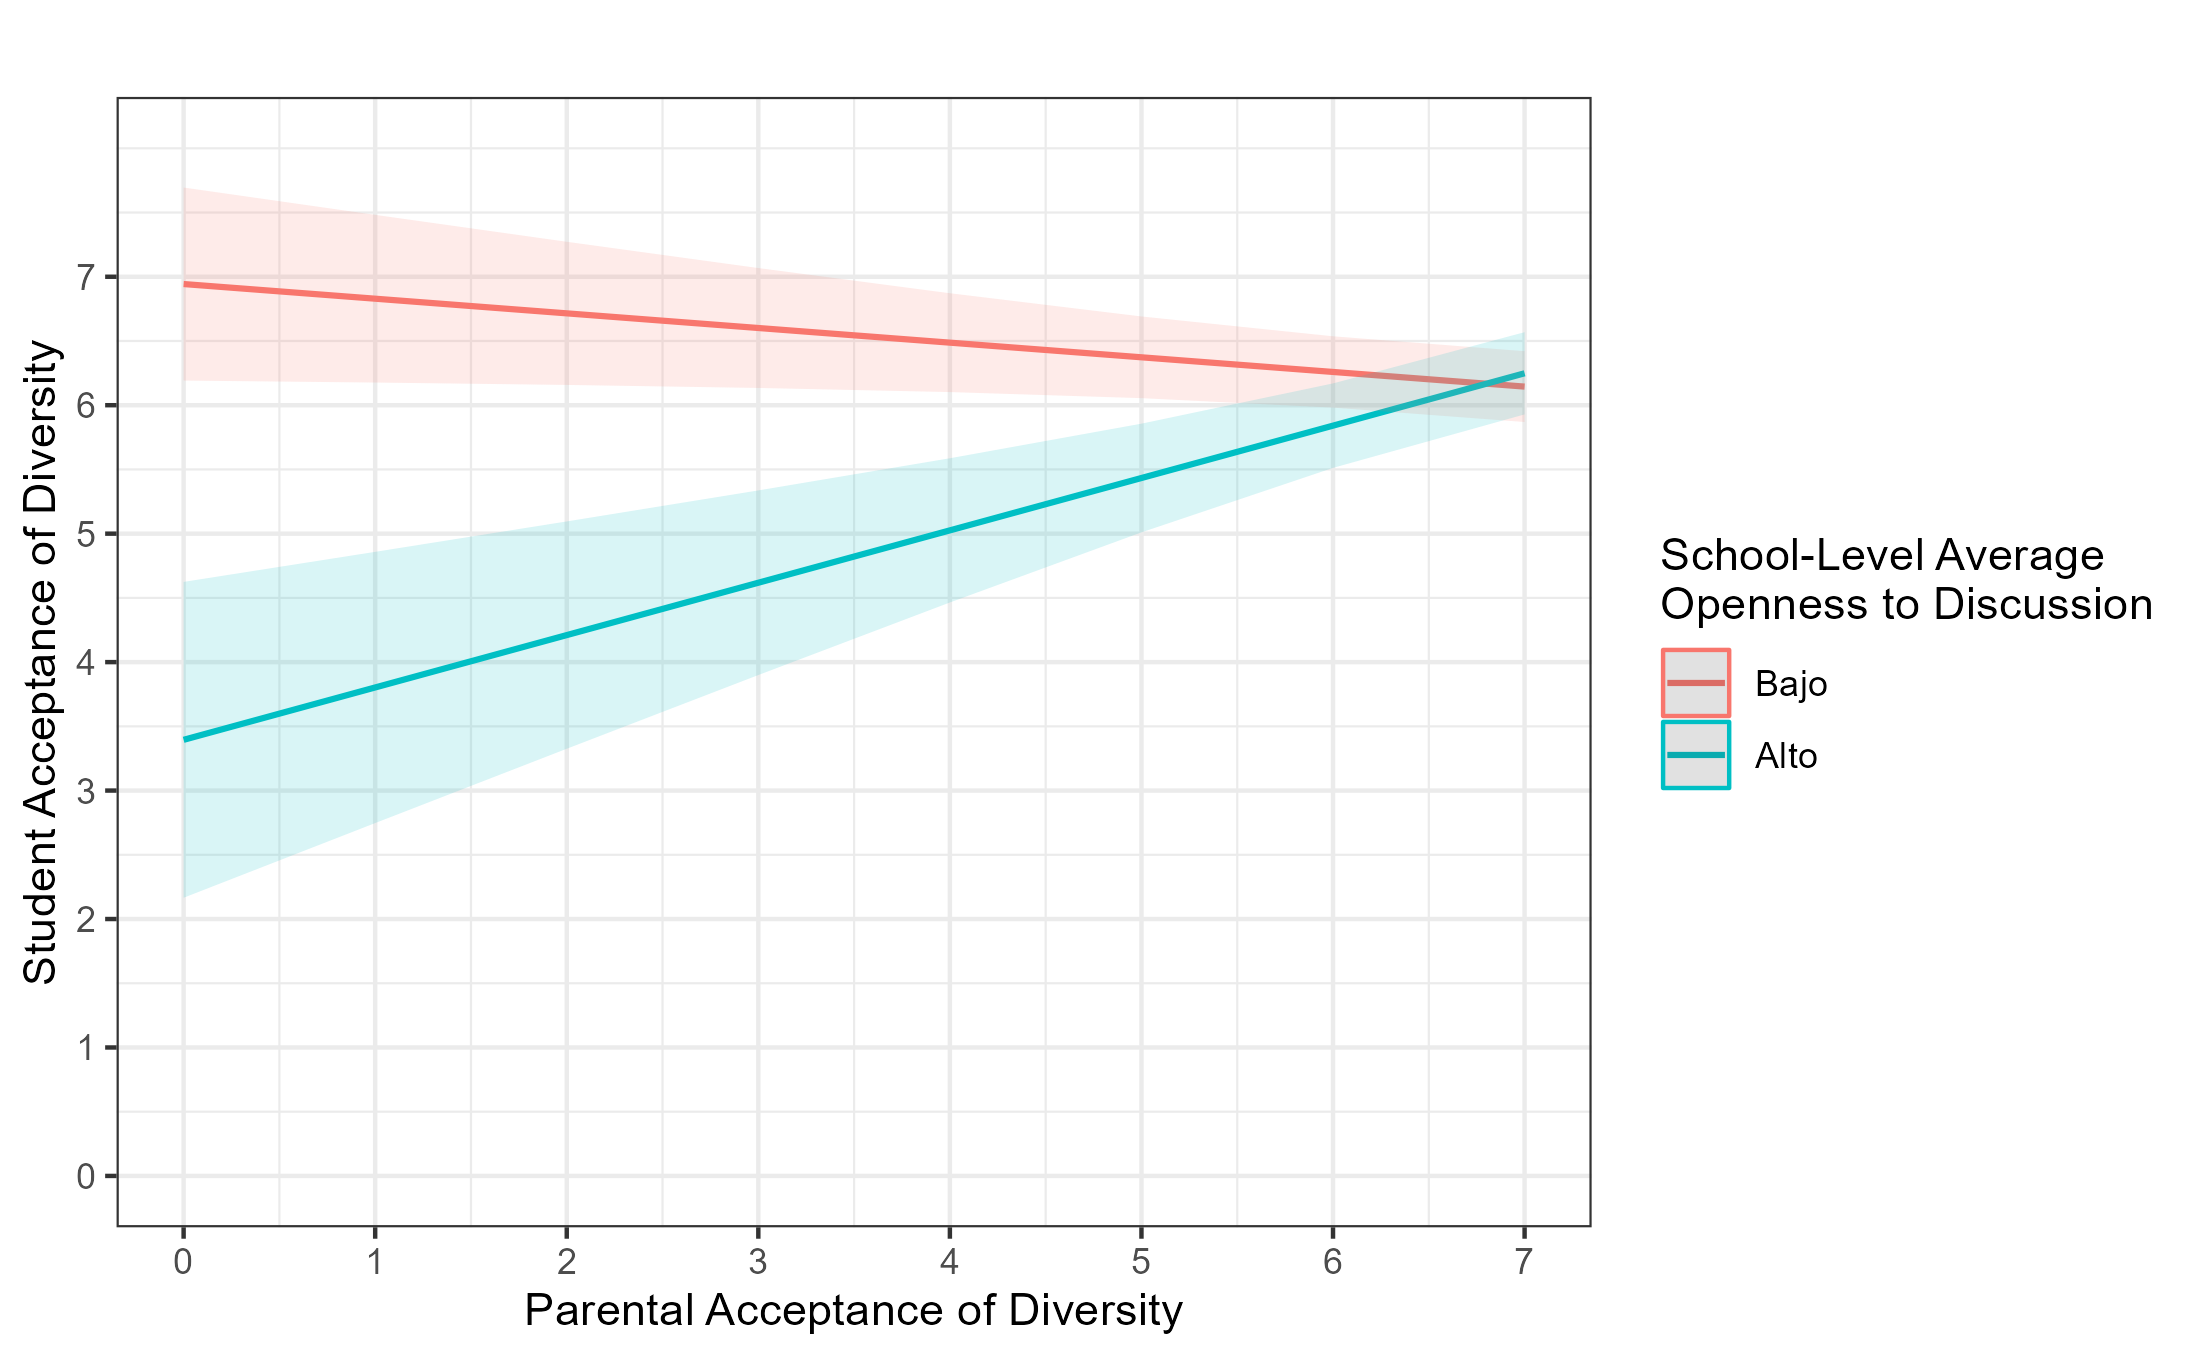
Figure 4.2: Relationship between Students’ and Parents’ Attitudes, Moderated by the School-Level Average Perception of Openness to Classroom Discussion
Figure 4.2 illustrates the interaction effect between students’ and parents’ attitudes, moderated by the school-level average perception of openness to classroom discussion. The relationship shows that in schools with a low perceived openness to discussion, the association between students’ and parents’ attitudes is negative. In contrast, in schools with a high perception of openness to discussion, students’ attitudes are positively associated with those of their parents. This suggests that in school environments that foster open discussion and debate, it is possible to improve the attitudes of students whose parents show low levels of acceptance of diversity.