3 Methods
3.1 Data
The dataset used in this study comes from the First Citizenship Education Study in Chile, conducted by the Agency for Quality Education of the Ministry of Education. The study assessed 8,589 eighth-grade students from 242 schools. Data collection took place on November 9, 2017. In addition, responses from 6,770 parents or guardians were collected through the Citizenship Education questionnaire. After merging both datasets, the total number of complete responses is 6,511 student–guardian pairs. The final sample used in the analyses consists of 4,801 cases.
In addition to the above, territorial-level variables are drawn from the 2017 Chilean Census, using the censo2017 statistical package in R (Vargas, 2022). This dataset provides territorial information corresponding to the year 2017 and is publicly available for unrestricted use.
3.2 Variables
To measure students’ attitudes toward diversity in their neighborhoods, the set of questions from the “Tolerance and Social Distance” module of the student questionnaire is used. These variables are based on the questions presented in Figure 3.1.
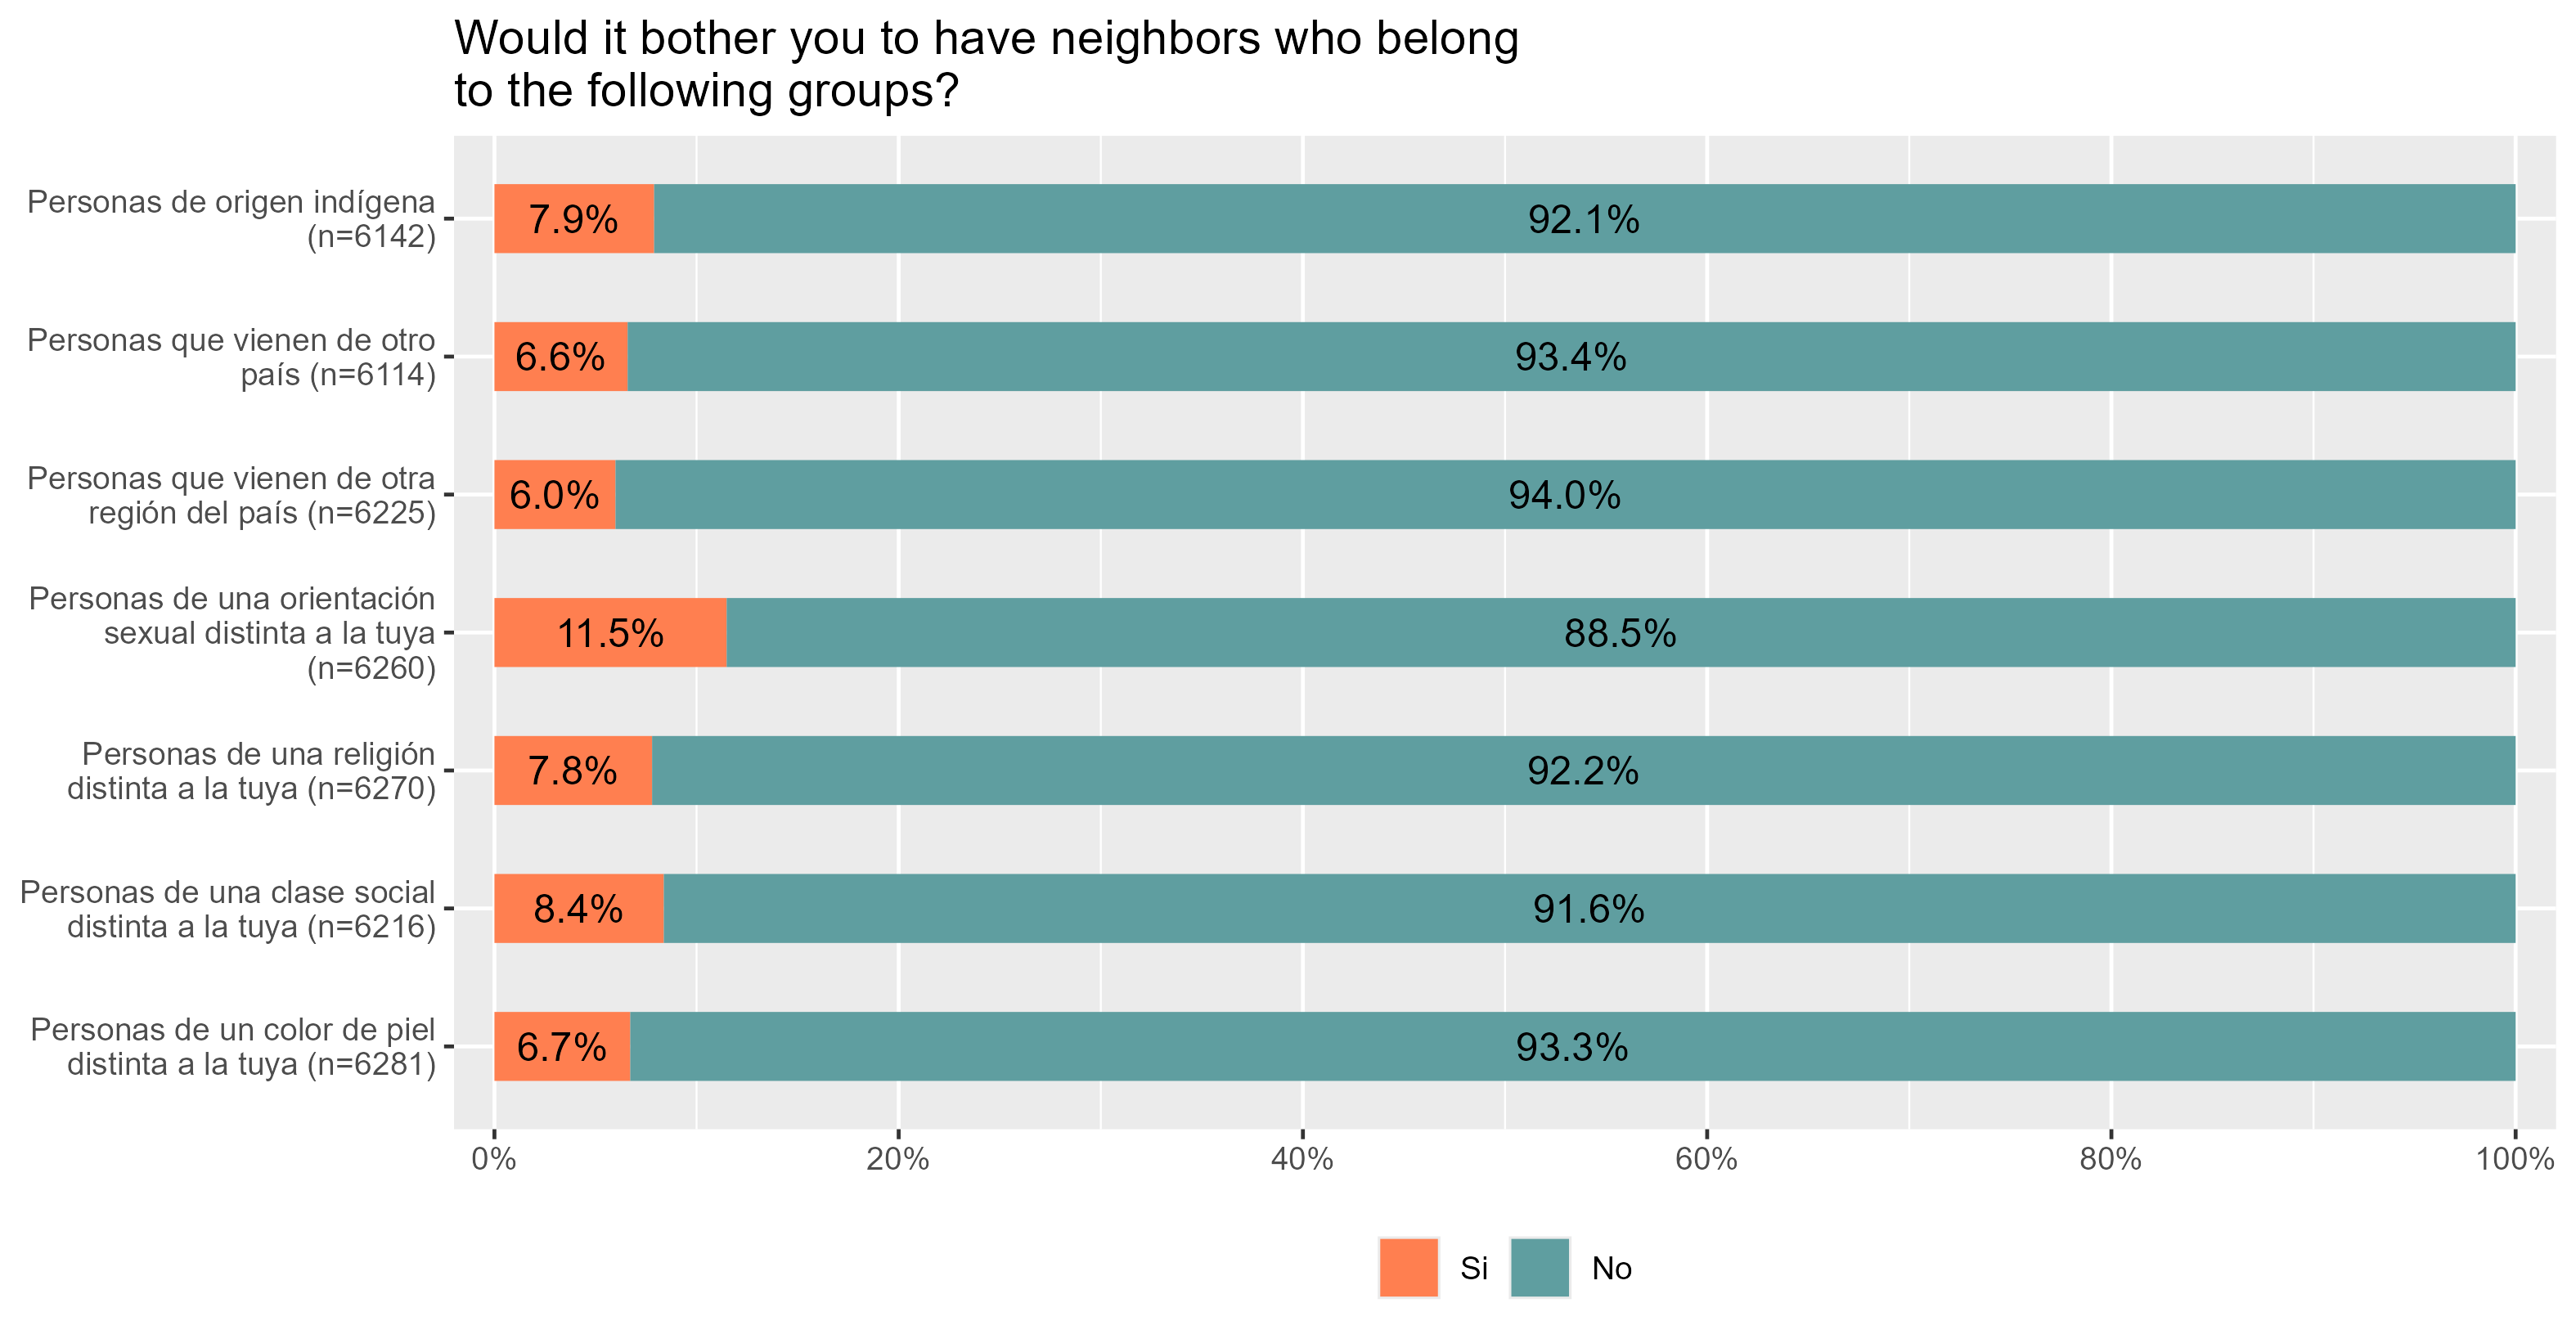
Figure 3.1: Acceptance of Diversity (Students)
To operationalize this set of questions, each item is first recoded so that a value of 0 indicates that the student would not like the respective group to live in their neighborhood, and a value of 1 indicates that they would. A summative index is then constructed by adding the values of all items, representing the overall level of acceptance of different social groups. The distribution of this index is shown in Figure 3.2. The Cronbach’s alpha for this index is 0.887.
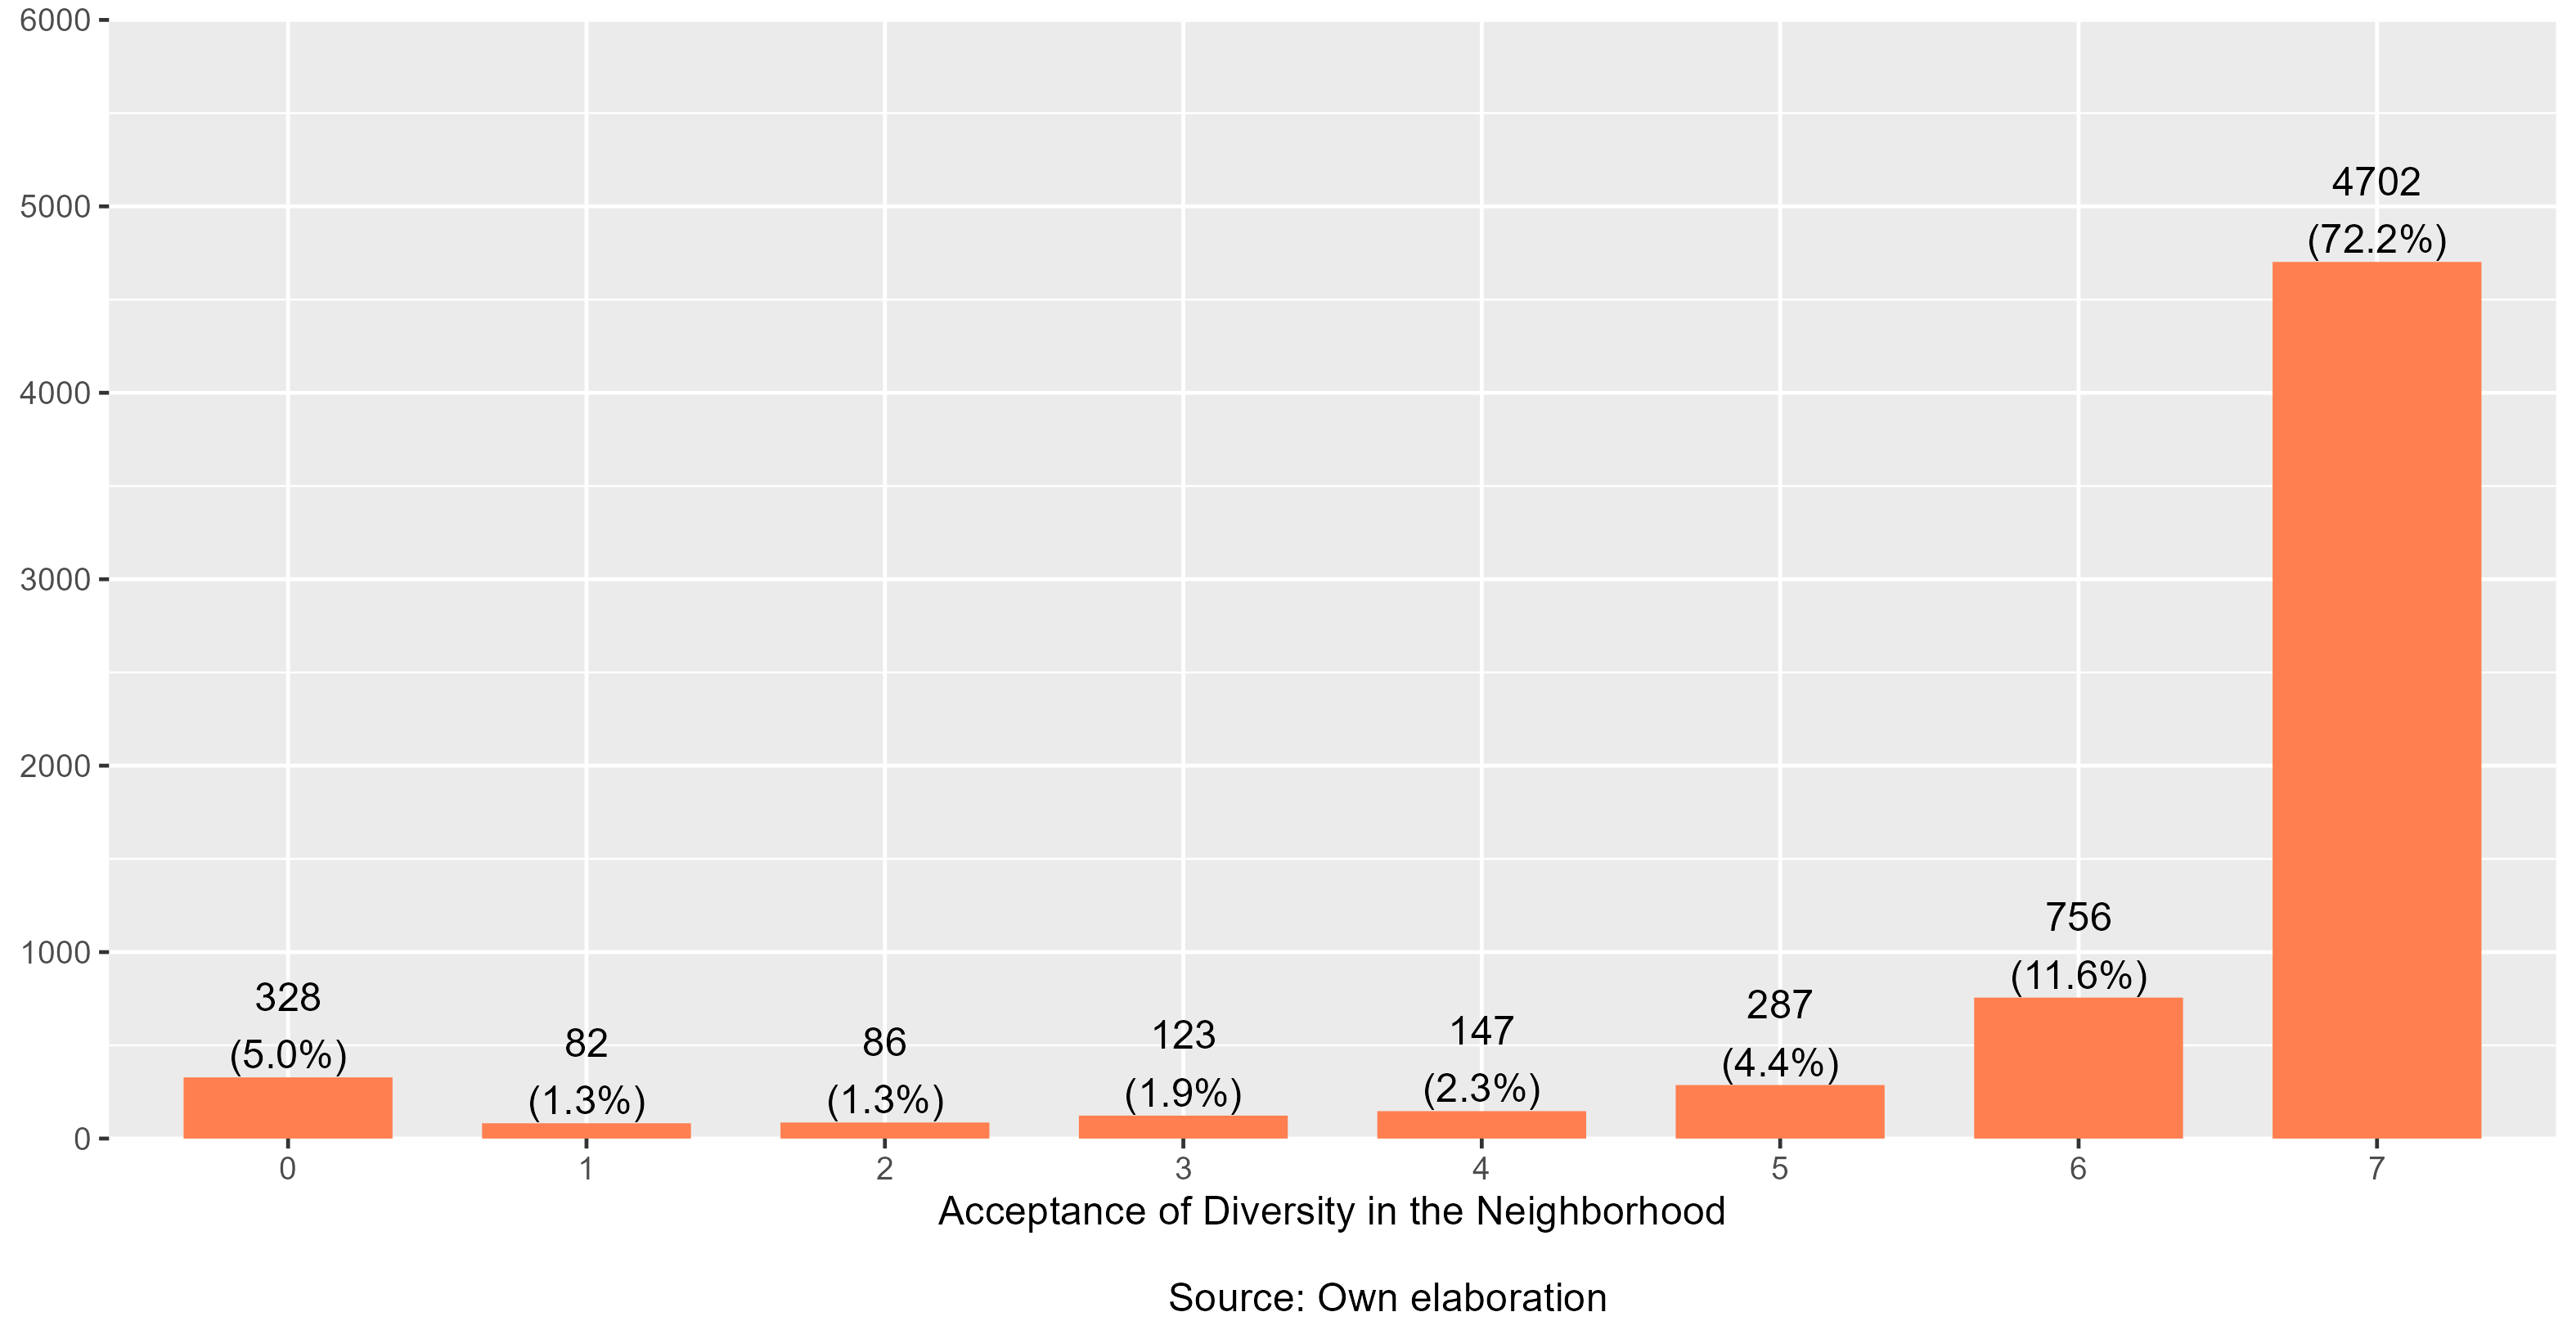
Figure 3.2: Diversity Acceptance Index (Students)
The independent variables are grouped into three categories: (1) family-related variables, (2) school-related variables, and (3) territorial-level variables.
- Family Variables
Socioeconomic resources are represented through two variables:
Educational level (highest level between respondent and spouse/partner): This variable is reported by parents or guardians. It is categorical and measured on a scale from 1 to 10, with 10 representing the highest possible level of education.
Number of books at home: A categorical variable reported by students, indicating the number of books available in the household. The response categories are: 1) 0 to 10 books; 2) 11 to 25 books; 3) 26 to 100 books; 4) 101 to 200 books; 5) More than 200 books
Parental attitudes:
- Parental acceptance of diversity: This variable is constructed using the same method applied to operationalize the dependent variable.
- School Variables
Civic knowledge: This variable is based on the civic knowledge test administered to students. The classification used follows the ICCS 2016 categories (Agencia calidad de la educación, 2018), where the “Below Level D” category corresponds to scores below 311 points; Level D includes scores between 311 and 394; Level C, between 395 and 478; Level B, between 479 and 562; and Level A, above 562 points.
Perceived openness to classroom discussion: This variable reflects students’ perceptions of the opportunities available in the classroom to discuss and express opinions on various topics of general interest. An Exploratory Factor Analysis (EFA) was conducted to estimate factor scores based on 5 of the 6 available items in the dataset (for more details, see Table 7.1 in Appendix 1).
School-level average perception of openness to classroom discussion: This variable is constructed by averaging the individual perception scores of openness to discussion at each school. It reflects the overall availability of classroom spaces and opportunities for discussion and expression of opinions at the school level.
- Territorial Variables
Proportion of people who identify with an ethnic group: This variable reflects the proportion of people in the municipality who identify as members of Indigenous groups, based on the 2017 Census. It is categorized into three levels: Low, Medium, and High.
Proportion of migrant population: This variable represents the proportion of immigrants in the municipality, also based on the 2017 Census. It is categorized into three levels: Low, Medium, and High.
Average years of schooling: The average level of educational attainment in the municipality, according to 2017 Census data. This variable ranges from 6.9 to 11.2 years.
A summary of these variables is presented in Table 3.1.
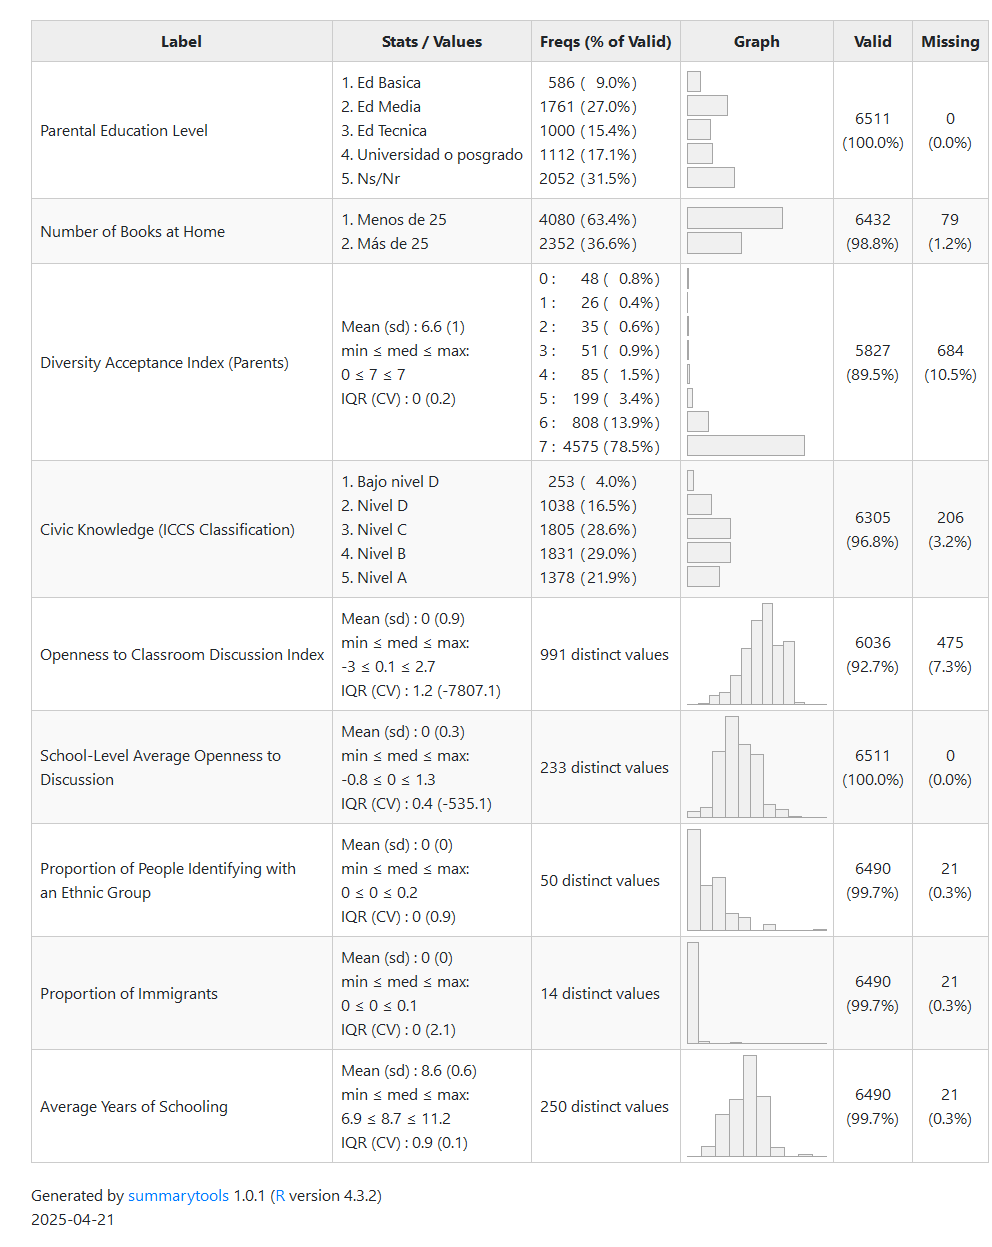
|
3.3 Analytical Strategy
The methodological approach of this study is quantitative in nature. The hypotheses were pre-registered on the Open Science Framework (OSF) platform, hosted by the Center for Open Science. The pre-registration document can be accessed at the following link. Statistical analyses were conducted using the open-source software R, version 4.0.0.
Given that the sample has a hierarchical structure—students nested within municipalities—multilevel regressions will be estimated to test all hypotheses. Recognizing that students are nested in municipalities allows for the inclusion of variables measured at different levels of analysis (Aguinis et al., 2013). Moreover, using a multilevel regression model makes it possible to isolate individual-level (student) effects from contextual-level (municipality) effects, and to analyze the variance of the outcomes at each level, as well as the proportion of variance explained by the independent variables at each level. Since the structural characteristics of groups are a key factor in explaining differences in student outcomes (Treviño et al., 2018), and because both municipalities and schools may vary in their shared values and norms (Bayram Özdemir et al., 2020), it is necessary to estimate multilevel regression models to determine whether students’ attitudes are shaped by individual-level responses or by contextual-level characteristics at the municipal level.
Conceptually, there are theoretical reasons to expect cross-level interaction effects. Therefore, moderation analysis models will also be estimated to determine whether the strength or direction of the effect of the independent variables on the dependent variable depends on a third variable (Hayes, 2022).
Thus, after estimating the intraclass correlation coefficients (ICCs) of the models—and following the steps recommended by Aguinis et al. (2013)—three general types of hypotheses are established for evaluation:
Direct individual-level effect hypotheses (H1, H2, H3, and H4)
Moderation hypothesis (H5)
Direct contextual-level effect hypotheses (H6, H7, and H8)